Reservoir level visualization project
Link
Tools
- D3
- Javascript
Categories
- Visualization
- Data wrangling
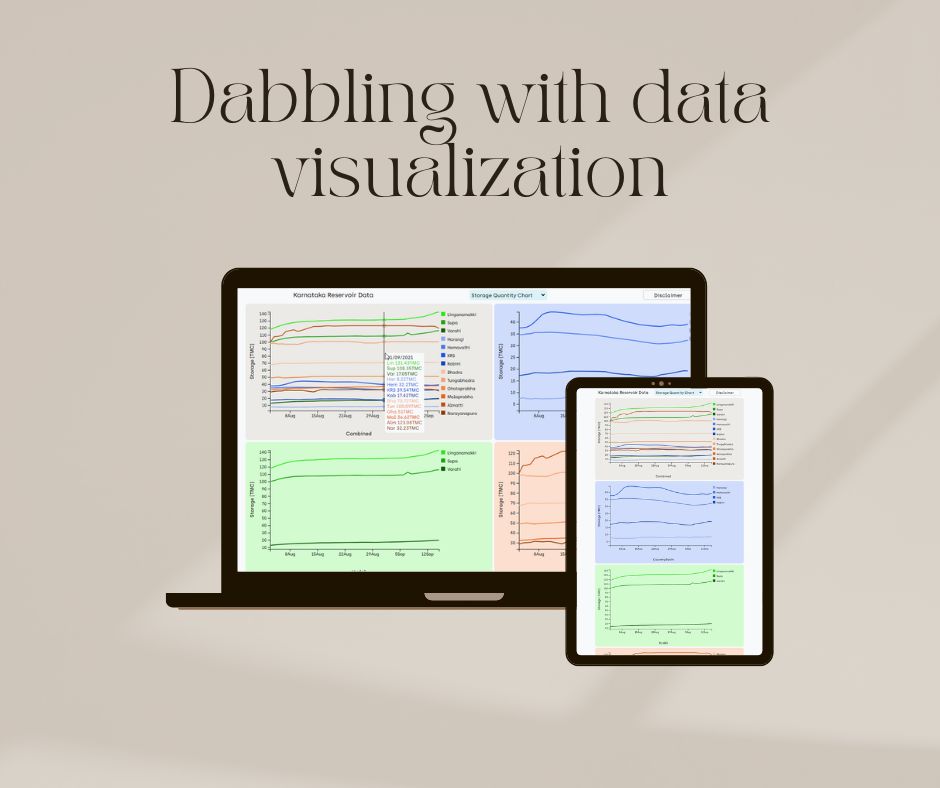
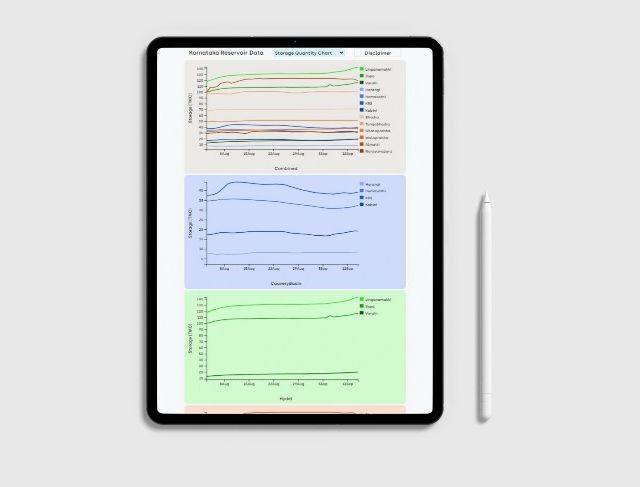
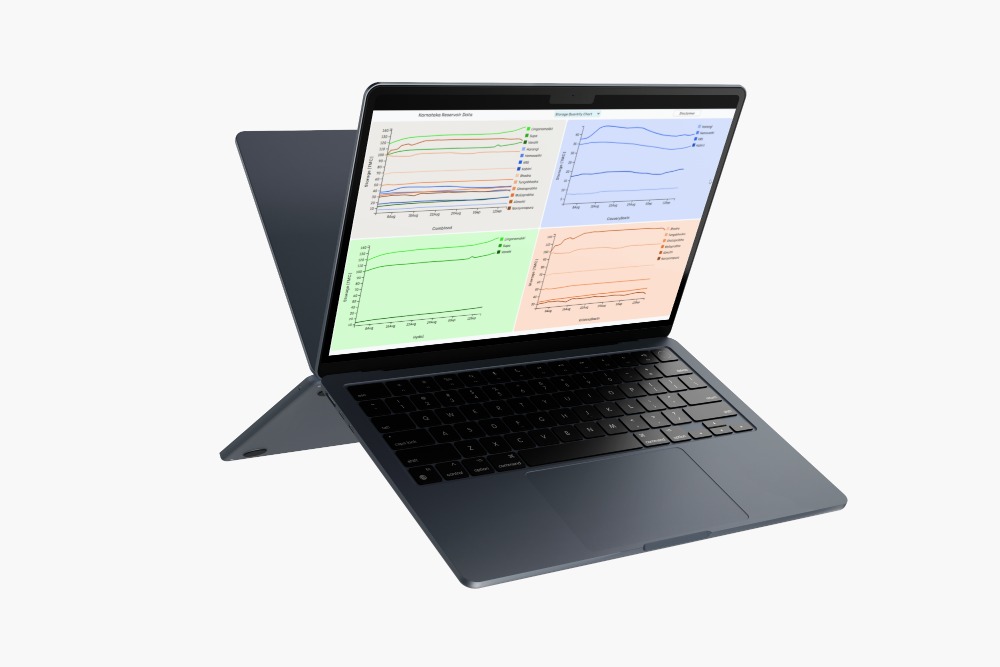
This is a web-app to visualize the water storage, capacity level in reservoirs.
This site was created as a part of me D3 learning process.
The site provides a comprehensive view of the water level, storage level and , storage
quantity of 13 major reservoirs across Karnataka over a time span of a month in 2021

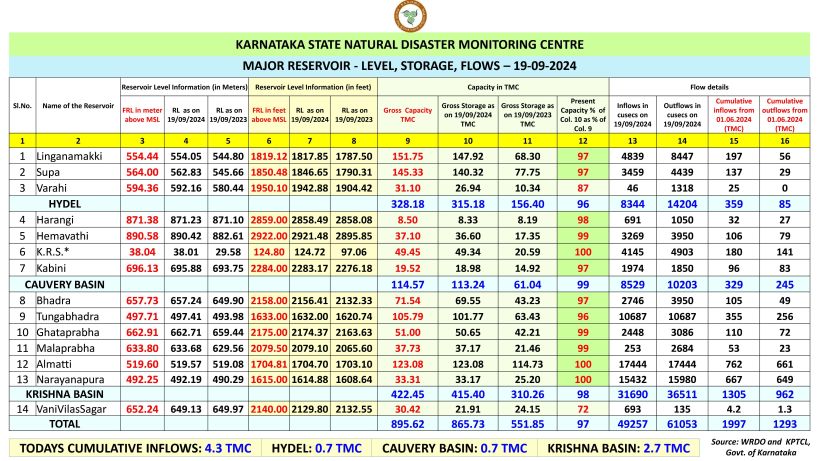
Motivation: The Karnataka State Natural Disaster Monitoring Center(twitter handle @KarnatakaSNDMC) publishes the water level chart -like the one below - of major reservoirs in Karnataka. I wanted to visualize them in a chart with tool tips showing values using the D3 Javascript library.

Process: KSNDMC publishes the chart has a picture and they do not
provide the data in any other format. So, the first challenge was to get the data in a
form that could be used in D3.
While it is possible to note down the data manually into an excel, it is
tedious and prone to errors to do so.
I created a small script in Python to optically read the picture and extract the
data as a table in Pandas. This was about 95% accurate but nonetheless much better
than the manual method.
The .csv file was then used to create the charts with D3.

Challenge: KSNDMC publishes the data at their whims. There is not set
pattern as to which day they will publish the data and which they will not. Hence
there are a lot of days missing in the chart 😔
I wanted to have data for years and wanted to even have a chart to compare the level
between years. However, do to lack of data, was not able to do it.

Lesson learnt: Have the data or at least a reliable source for it before you embark on a data visualization project.